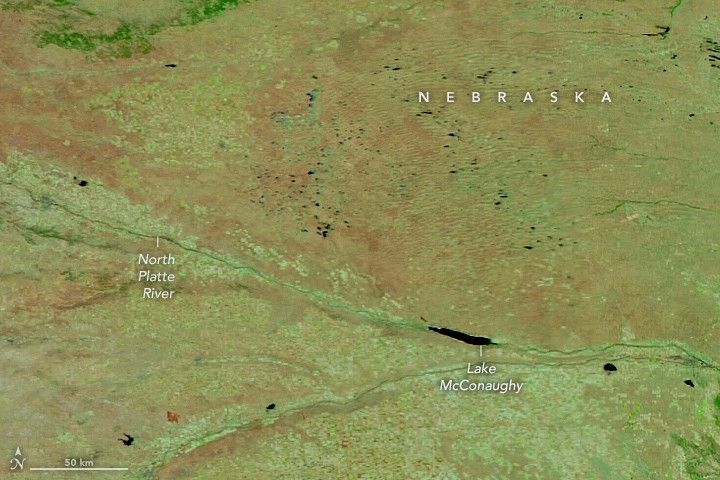
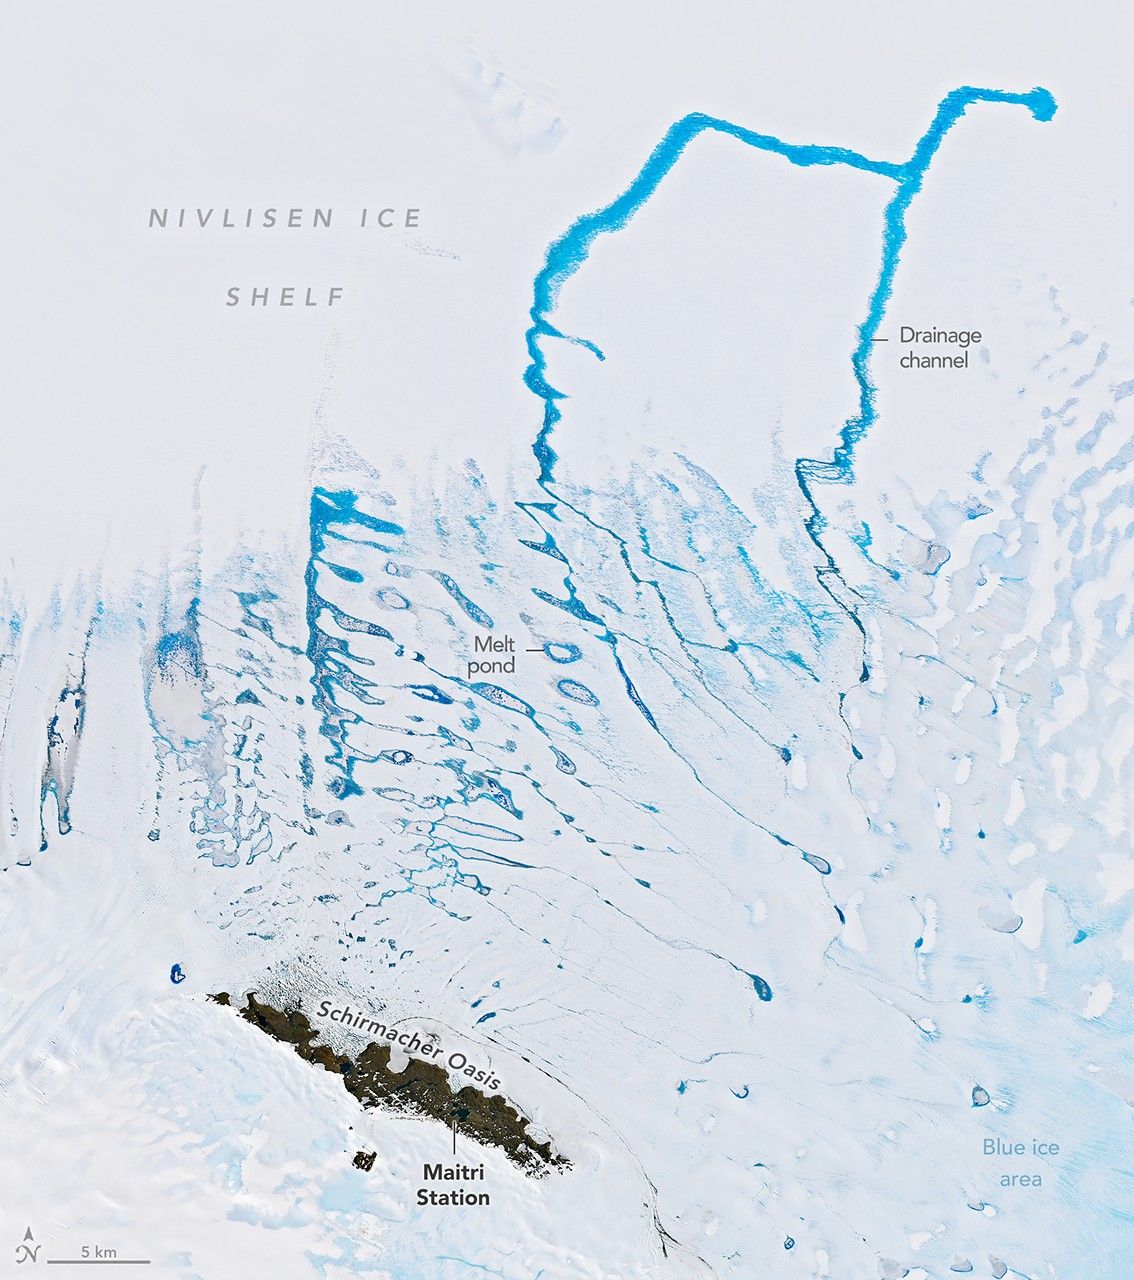
Landsat Reveals Reservoir Changes and Bathymetry
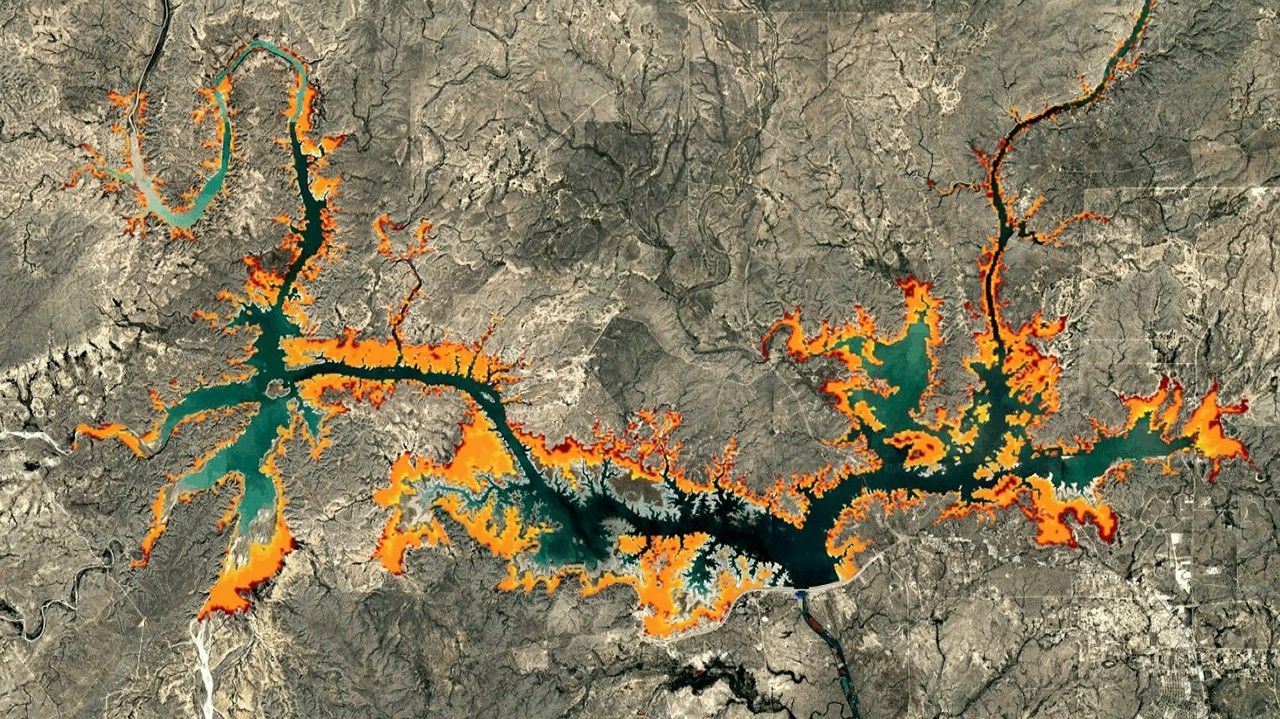
Researchers from the University of Southampton and Texas A&M University have published two complementary studies that use Landsat imagery to map permanent surface‑water changes and to generate a global lake‑bathymetry product. The Southampton team examined Landsat data from 1984 through 2022 to pinpoint the exact year that reservoirs, streams or lakes either appeared or disappeared, producing the first worldwide catalogue of permanent water‑body transitions. The Texas A&M effort combined Landsat observations with ICESat‑2 laser altimetry to create “3D‑LAKES,” a static bathymetric database covering roughly half a million lakes and reservoirs, illustrated with an example of the Amistad Reservoir on the Texas‑Mexico border. Both papers were released in 2025‑2026 and are hosted on NASA’s Landsat Project Science Support portal.
The surface‑water analysis relied on Landsat 5, 7, 8 and 9 sensors, employing the Modified Normalized Difference Water Index that uses the shortwave‑infrared band, and a newly introduced Green‑Red NDWI to assign a transition year to each pixel. The algorithm excluded seasonal fluctuations, labeling a change permanent only if the water condition remained unchanged for the full 1984‑2022 period. Spatial resolution allowed detection of streams as narrow as 30 metres and lakes as small as 900 square metres, and results are visualised through Google Earth Engine with colour‑coded maps of advancing (blue) and retreating (red/orange) water. For bathymetry, the 3D‑LAKES workflow calculated surface area from Landsat, delineated shorelines, and merged those measurements with ICESat‑2 elevation profiles to derive area‑elevation curves, which were overlaid on a Copernicus Digital Elevation Model. The final product displays shallow zones in green and deeper zones in purple, and, because bathymetry changes little year‑to‑year, the dataset remains static while supporting volume estimates for flood‑risk analysis and water‑resource accounting.
Together the datasets fill long‑standing gaps in global water‑resource monitoring by providing high‑resolution change detection and underwater topography that were previously limited to costly field surveys. Water managers can now couple the surface‑transition maps with 3D‑LAKES to quantify storage capacity, assess drought impacts, and refine hydrological models across regions from the American Southwest to the Brazilian Amazon. The tools also complement in‑situ gauge data, offering a satellite‑based baseline for international agencies such as the International Boundary and Water Commission and for climate‑impact studies that depend on accurate freshwater inventories.